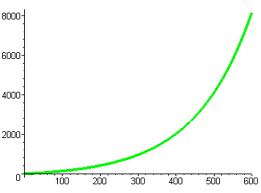
This is a logistic growth curve, or an S-shaped curve. This occurs when a population reaches a carrying capacity (k) where k is the maximum number of organisms that the environment can sustain. Once the population overshoots, a dieback occurs because the population has run out of resources and can not support that many organisms.
Scientists have classified species into r-selected and k-selected species.
R-SELECTED SPECIES K-SELECTED SPECIES
1. Many offspring Few offspring
2. Minimum parental care High parental care
3. Reproduce early and many times Reproduce late and few times
4. High population growth rate Low population growth rate
5. Generalist species Specialist species
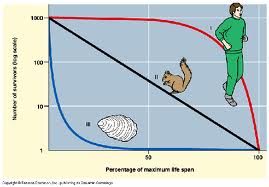
Furthermore, scientists have come up with three general survivorship curves: early loss, constant loss, and late loss.
The graph has age of the organism on the x-axis and percentage of organisms surviving on a log scale on the y-axis. The red line represents late loss because most of the organisms survive longer. The black line represents constant loss where organisms die off regularly. The blue line represents early loss where the survival rate of the young is low, but those who survive tend to live a long time. Examples of late loss are humans and rhinos, constant loss are squirrels and birds, early loss are fish.
QUIZ QUESTION: Are humans k-selected or r-selected species?
If you answered either or, you would be CORRECT! There is an extensive debate among scientists as to which category humans fall into because we reproduce like crazy. Personally, I think humans are k-selected species but thats up for debate. ;)


No comments:
Post a Comment